
Under the topic on Heat Energy, most primary school students know how to tackle questions on heating curves because they are frequently tested in the examinations.
However, when they are tested on cooling curves, they are thrown off guard as they are unsure of how to analyse these questions accurately.
As such, in this article, I will be discussing the thought processes required to answer these questions.
What is a “cooling curve graph”?
A cooling curve is a line graph that illustrates the change in state of matter of an object, generally from gas to liquid, and/or liquid to solid.
Read Also
As the object is cooling, it means that the temperature of the object is decreasing, rather than increasing in a heating curve graph. In a cooling curve graph, the object is losing heat to the surroundings and undergoes a heat process, which causes a change in state.
With this understanding, let us take a look at the question below.
Question
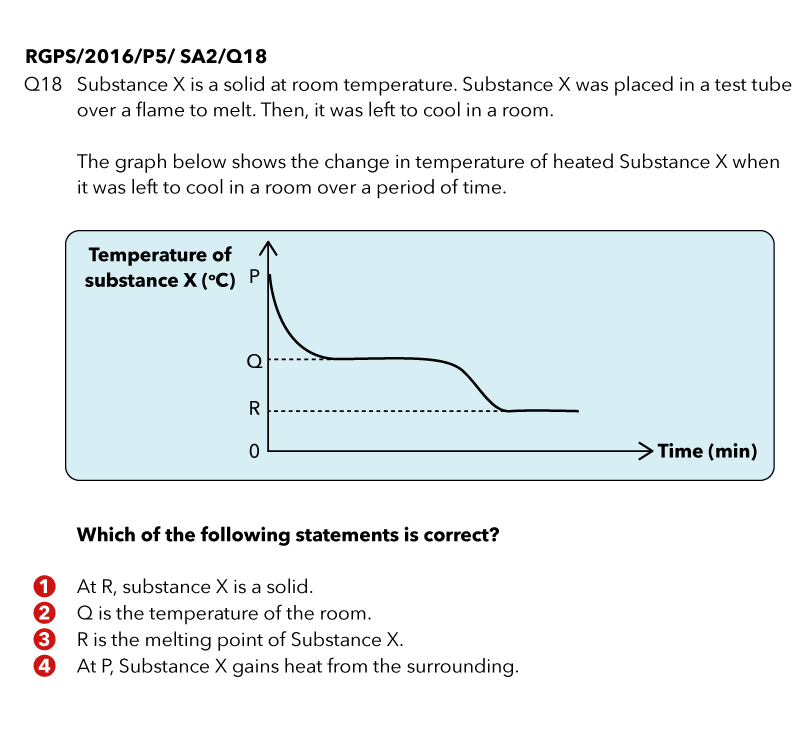
Source: Raffles Girls’ Primary School – 2016 P5 SA2 Science Examination Paper (Q18)
Source: Raffles Girls’ Primary School – 2016 P5 SA2 Science Examination Paper (Q18)
Thought Process
Firstly, let us take a look at the information given in the question.
“Substance X is a solid at room temperature.”
Interpretation 1: Substance X is in the solid state at room temperature.
“Substance X was placed in a test tube over a flame to melt.”
Interpretation 2: When heated, Substance X melted, changing from solid to liquid state.
This means that Substance X was in the liquid state when it was left to cool in the room. Thus, at P (the start of the graph), Substance X was a liquid.
Secondly, let us analyse the graph.
(i) The temperature of Substance X decreases over time.
This shows that Substance X is losing heat to the cooler surrounding air and decreases in temperature.
(ii) The temperature of Substance X remains the same first at Q, then at R.
Similar to the heating curve graph, there are two possible reasons why the temperature of a substance remains constant.
- The substance is undergoing a heat process (change in state).
- The substance is at room temperature and there is no transfer of heat between the substance and the surroundings.
If Q is the room temperature, it means that the temperature of Substance X and the surroundings would be the same. Thus, there would not be any heat transfer and the temperature of Substance X would not decrease again at a later time. However, the temperature of Substance X decreases again after Q. Thus, it is not possible for Q to be the room temperature.
As such, Substance X is undergoing a heat process at Q, which is freezing, and is turning from liquid to solid. Thus, Q is the freezing/melting point of Substance X.
The temperature of Substance X decreases again after Q and finally remained constant at R. This shows that there is no more heat transfer between Substance X and the surroundings and Substance X, which is in the solid state, has reached room temperature at R.
Thus, the answer is Option (1).

If you like our methodology, we’ve some upcoming workshops:


