
Welcome Back To Our Examination Paper Analysis Series!
Today, I will be analysing a question from the topic of Web of Life in the 2018 Nanyang Primary School (NYPS) P6 Prelim Examination Paper.
Web of Life is an interesting topic about how different organisms in the food web depend on each other directly/ indirectly for food. In this topic, we will be able to observe how a change in the population of just one organism can greatly affect the population of all the other organisms in the food web!
As usual, I will first share with you the topic weightage before discussing the question.
Topic Weightage In Nanyang Primary School (NYPS) P6 Prelim Examination Paper
P6 Topics
Here is the list of topics that are commonly taught in the P6 curriculum and the number of questions tested for each topic:
- Energy (3 MCQs, 1 OEQ)
- Forces (2 MCQs, 1 OEQ)
- Living Together + Web of Life (5 MCQs, 2 OEQs)
- Adaptations (5 MCQs, 1 OEQ)
- Man’s Impact On The Environment (2 MCQs)
P5 Topics
Here are the list of topics that are commonly taught in the P5 curriculum and the number of questions tested for each topic:
- Cells (Not tested)
- Water Cycle (1 MCQ)
- Human/Animal Reproductive System (1 MCQ)
- Circulatory System & Respiratory System (1 MCQ, 1 OEQ)
- Plant Reproduction and Plant Cycle (1 MCQ, 1 OEQ)
- Electricity (2 MCQs, 1 OEQ)
P3/4 Topics
Here are the topics that are commonly taught in the P3 and P4 curriculum and the number of questions tested for each topic:
- Diversity (Not tested)
- Materials (Not tested)
- Animal Life Cycle (Not tested)
- Digestive System (1 MCQ, 1 OEQ)
- Magnets (2 MCQs, 1 OEQ)
- Matter (Not tested)
- Light Energy (1 MCQ, 1 OEQ)
- Heat Energy (1 MCQ, 2 OEQs)
Summary
The table below is a summary of the topical weightage in this paper:
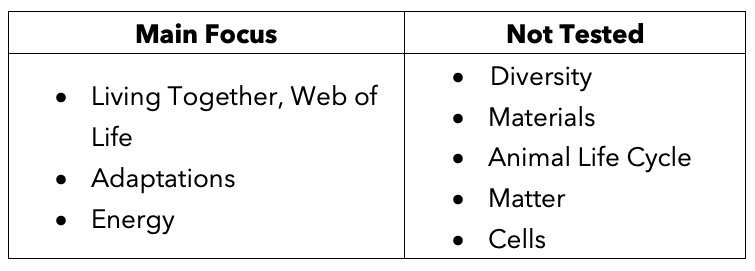
As seen from the topic weightage above, every P6 topic was tested in this paper.
Hence, if your child would like more question exposure on these topics, the 2018 Nanyang Primary School (NYPS) P6 Prelim Examination Paper will be ideal to practise!
If your child wants to work on questions on Diversity, Materials, Animal Life Cycle, Matter and Cells, this paper is not ideal.
Read Also:
Since Web of Life is an interesting topic, I would like to discuss Q5, a challenging question from this topic in the examination paper.
Question Analysis

Source: Nanyang Primary School (NYPS) – 2018 P6 Prelim Examination Paper [Q5]
Thought Process
When a food web is given in a Web of Life question, there are 2 tips that I share with my students:
- Identify the food producer(s)
The food producer(s) does/ do not feed on anything and is/ are only eaten by other organisms.
Food producer(s) only has/ have arrows pointing away from itself/ themselves in the food web.
- Identify the “King(s)”
The “King(s)” feeds/ feed on other animals but no other animals feed on it/ them.
“King(s)” only has/ have arrows pointing towards it/ them.
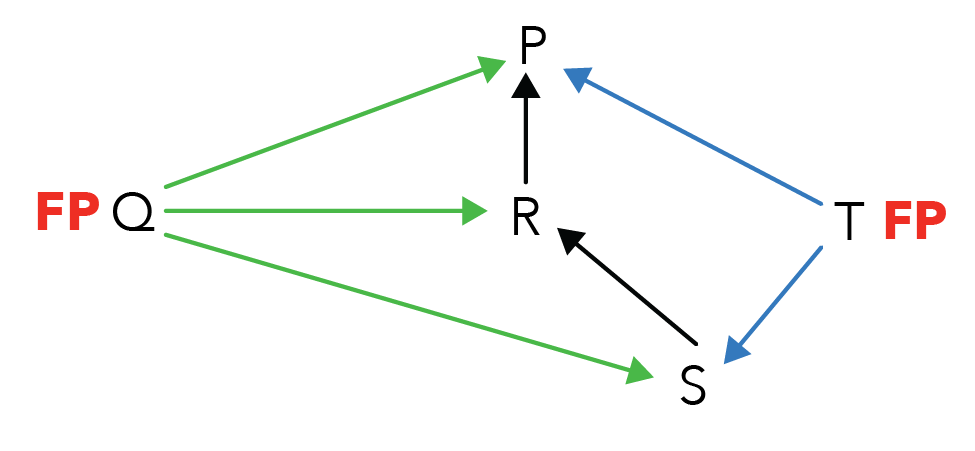
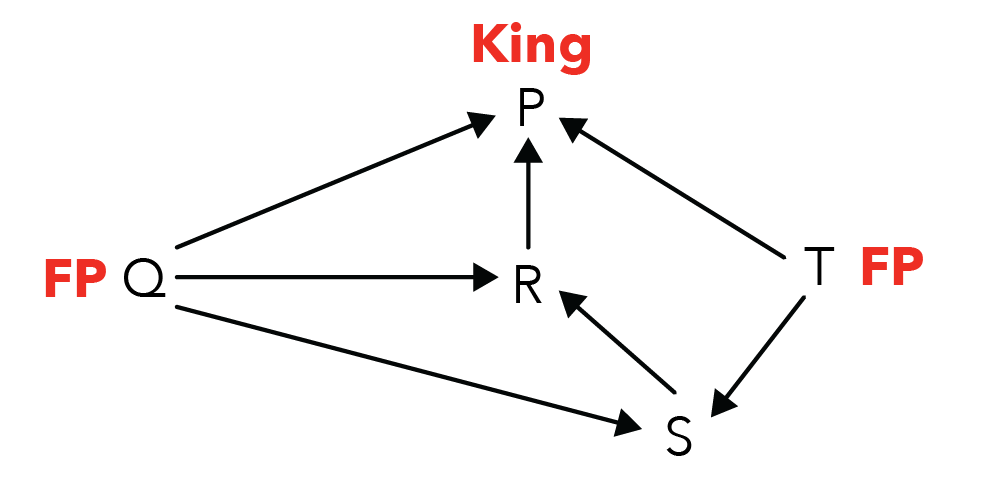
Since organisms Q and T only have arrows pointing away from themselves as shown below, we can identify Q and T as the food producers and label “FP” beside Q and T on the food web.
Since organism P only has arrows pointing towards it as shown below, we can identify P as the “King” and label “King” on top of P on the food web.
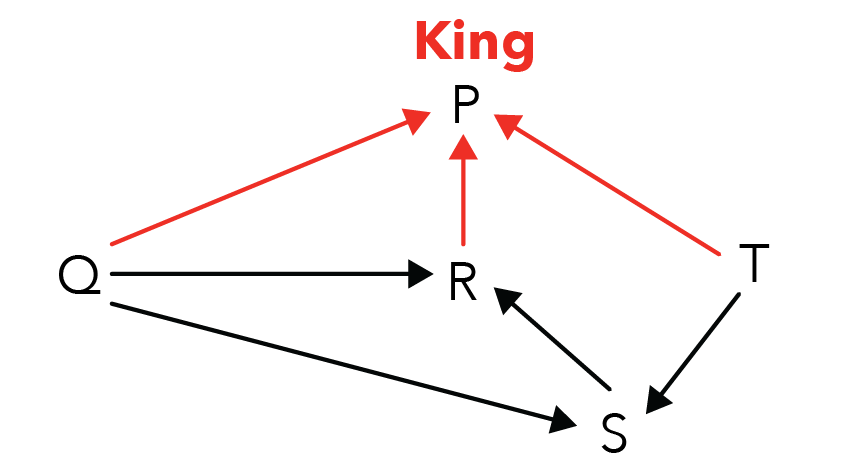
Both the “FP” and “King” are now labelled on the food web as shown below:
After identifying the food producers and the “King”, we can now proceed to find out the change in the population size of P, Q and S when the population of R increased.
Since the question specified that the population of R increased rapidly, let us first label an upward arrow beside R on the food web, as shown below:

Next, we will now identify the food relationships between P, Q, R and S by looking at the food web.
The food relationships are summarised below:
- P is the predator of R. (R –> P)
When the population of R increased rapidly, this means that there will be more R for P to feed on.
Thus, the population of P will increase, as indicated by an upward arrow beside P on the food web.
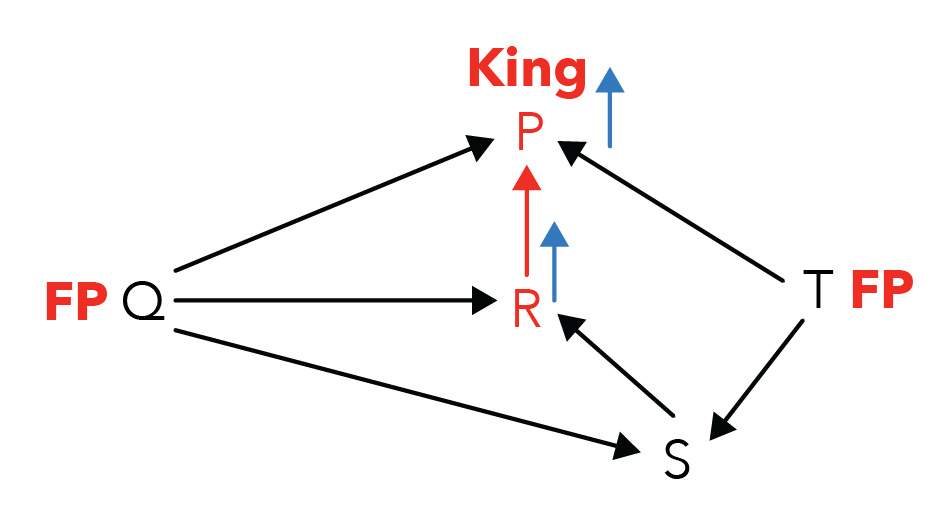
- R is the consumer of both Q and S.

When the population of R increased rapidly, there will be more R feeding on Q and S.
Thus, the population of both Q and S will decrease, as indicated by a downward arrow beside Q and S on the food web.
The completely labelled food web will be as shown below:

Now that we have found out the change in population size of P, Q and S, how is the change in population size represented in graphs?
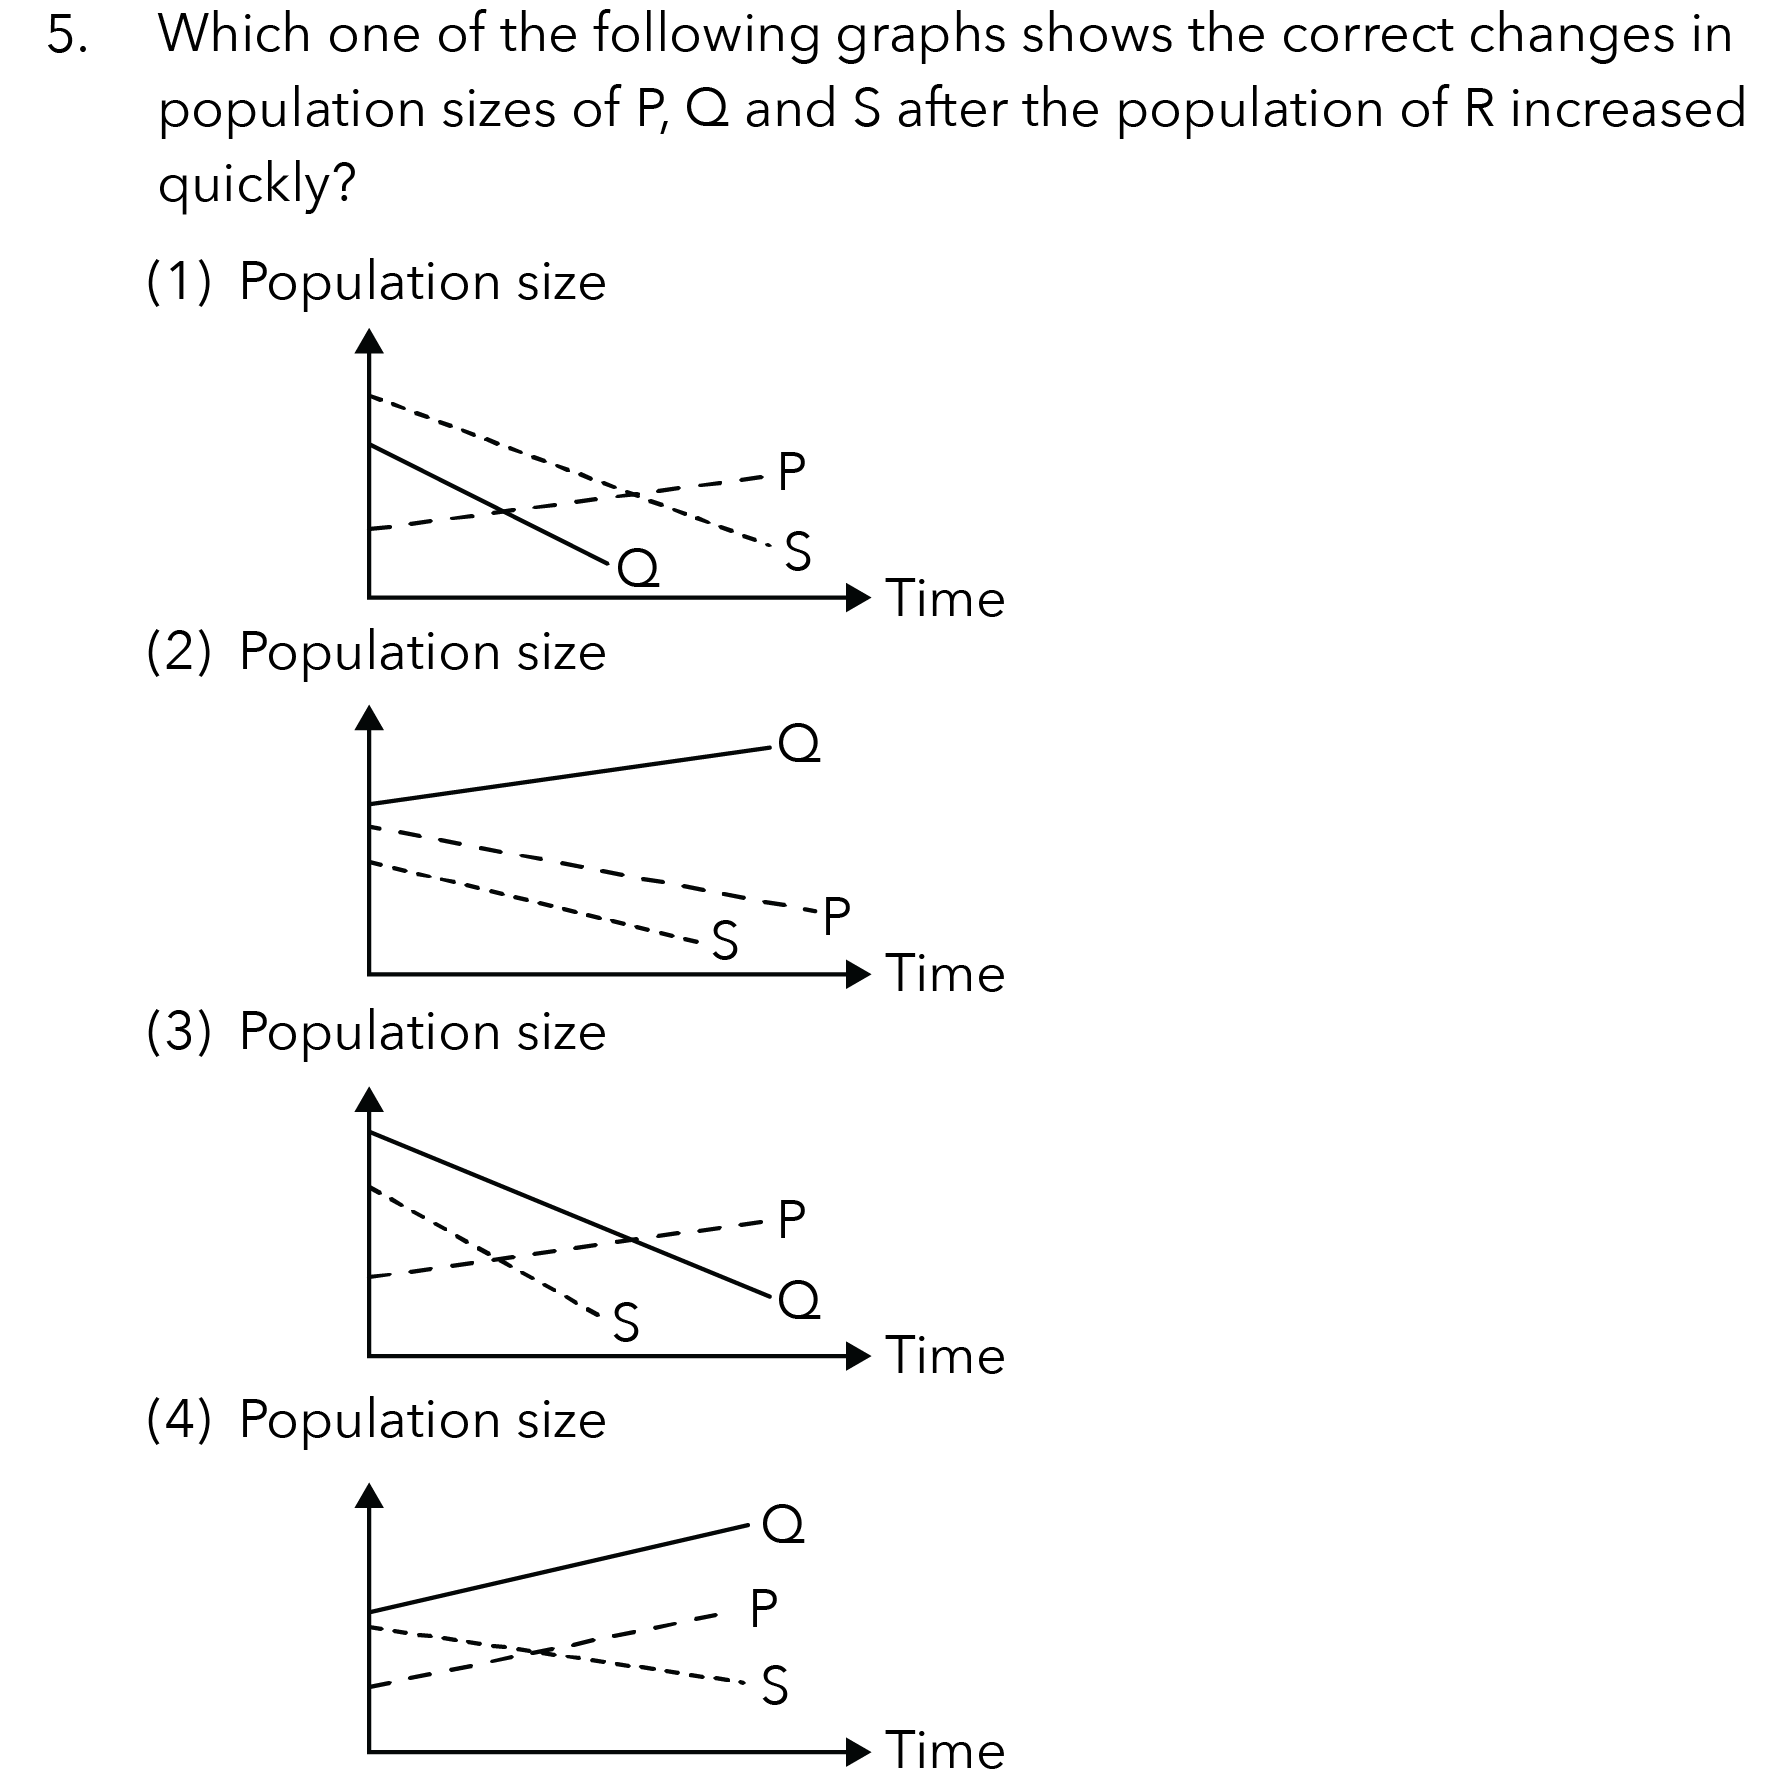
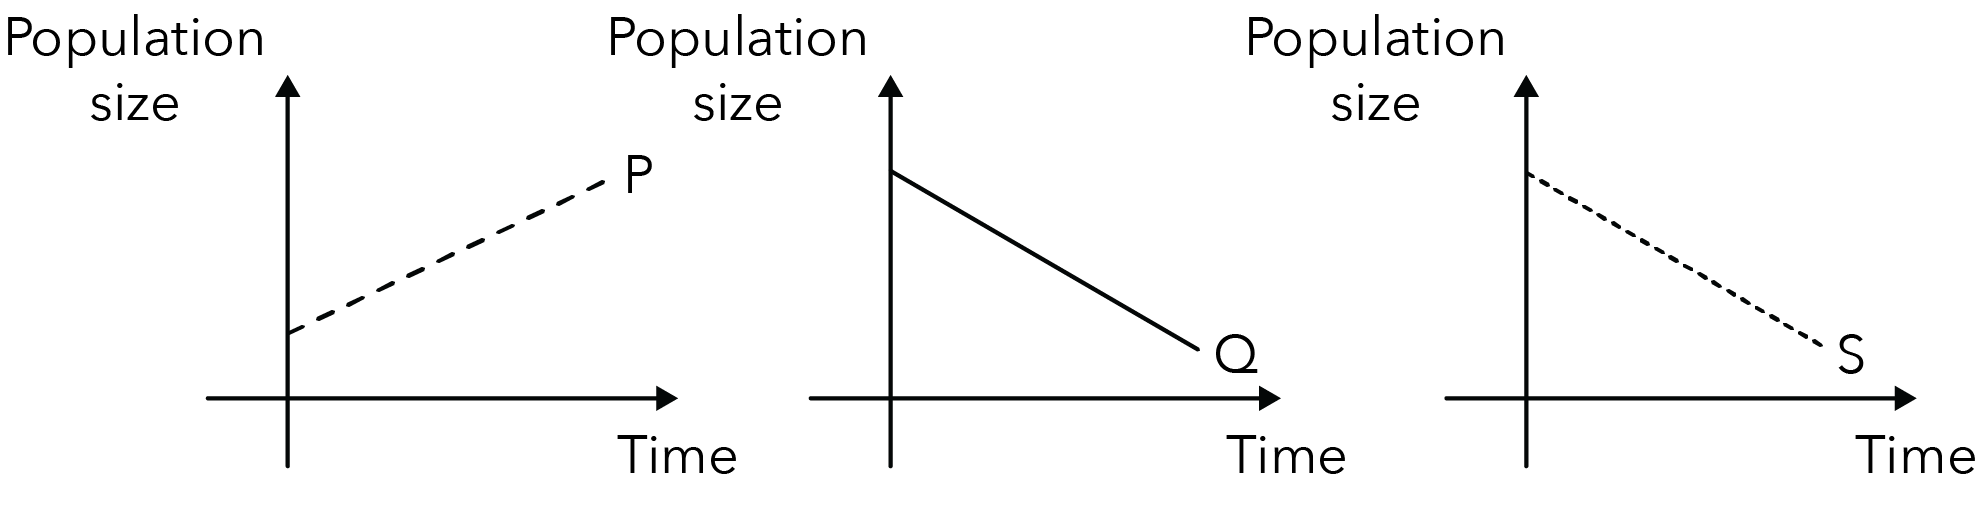
Since the population of P increases, it should be represented by an upward-sloping line on the graph.
On the other hand, since the population of Q and S decreases, they should be represented by downward-sloping lines on the graph.
The slope of the line for P, Q and S should be as follow:
With this information, let us now look at the options in the question and determine which options can be eliminated based on the slope of each line.
Let us look at option (2) first:
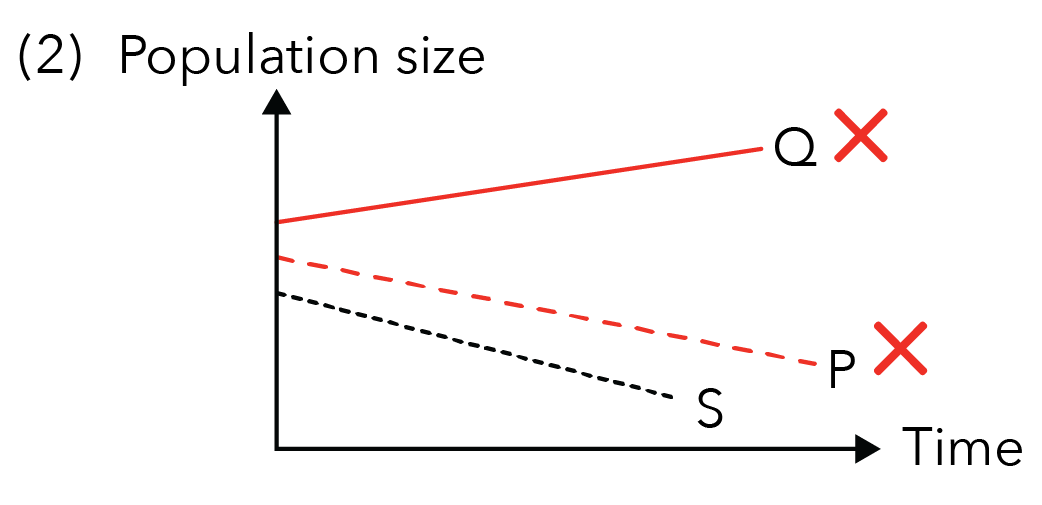
Since option (2) shows that the population of P decreases instead of increases, and the population of Q increases instead of decreases, option (2) is incorrect.
Next, let us look at option (4):
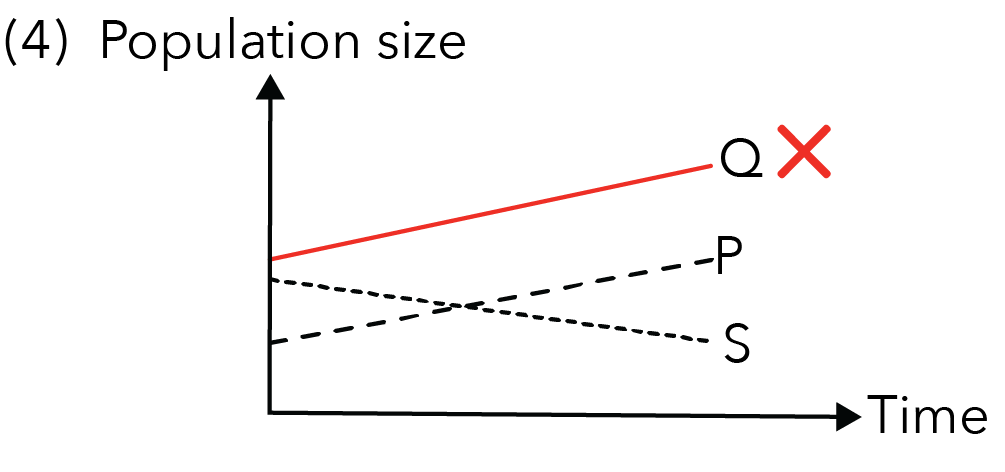
Since option (4) shows that the population of Q increases instead of decreases, option (4) is incorrect.
As of now, both options (2) and (4) are incorrect and have been eliminated.
Let us now look at options (1) and (3):

Since both options (1) and (3) show that the population of P increases while the population of Q and S decreases, based on the slope of the lines alone, both (1) and (3) are possible answers.
How do we then determine if option (1) or (3) is the correct answer?
This is where students usually struggle.
⭐️ Tip: Besides checking for the slope of each line as shown above, students also have to remember to check for the initial population size of each organism.
To determine the initial population size of each organism, it is important to remember the following:
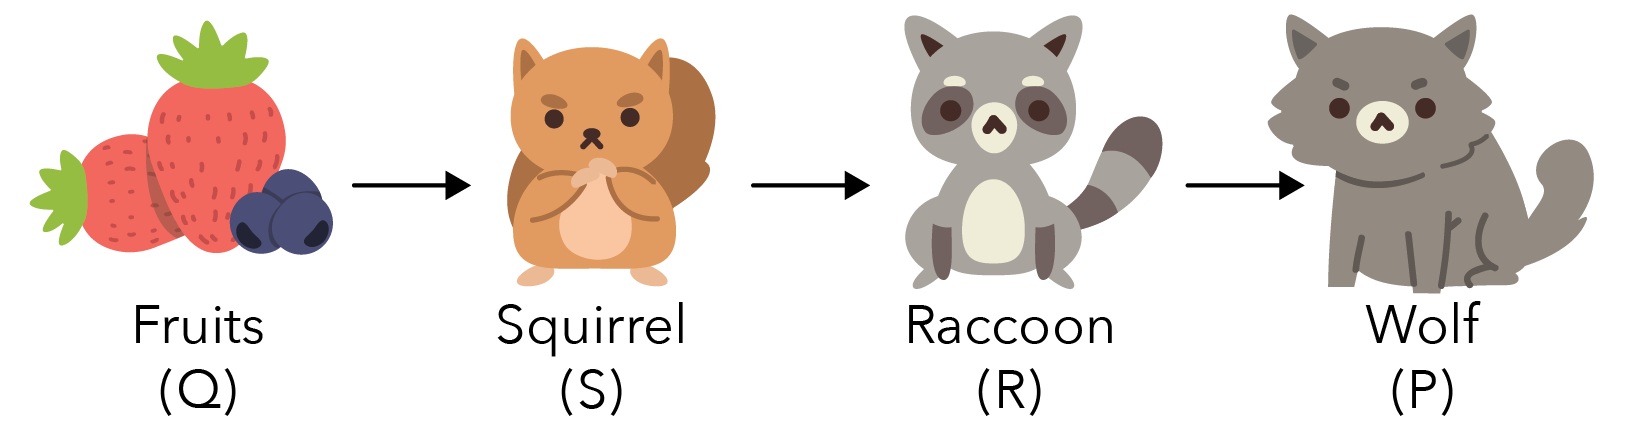
(1) A food web/ chain always starts with a food producer and end with the “King”.
By using actual organisms to represent Q, S, R and P, in the food chain below, fruits will be the food producer while the wolf will be the “King”.
(2) As we move from the start to the end of the food web/ chain, the initial population size of the organism decreases.
Why is this so?
Imagine a scenario where the population size of the organism increases from the start to the end of the food chain (2 fruits, 20 squirrels, 200 raccoons and 2000 wolves).
There will be insufficient food for all organisms in the food chain, causing all organisms to die.
On the other hand, when the population size of the organism decreases from the start to the end of the food chain (2000 fruits, 200 squirrels, 20 raccoons and 2 wolves), all the organisms will have sufficient food to feed on and survive.
Thus, we can conclude that the population size of the organism should decrease as we move from the start to the end of the food web/ chain.
Combining points (1) and (2), we understand that:
- The food producer at the start of the food chain/ web should have the largest initial population size while
- The “King” at the end of the food chain/ web should have the smallest initial population size.
Looking back at the food web in the question, Q, the food producer, should have the largest initial population size while P, the “King”, should have the smallest initial population size.
Let us look back at options (1) and (3) again:
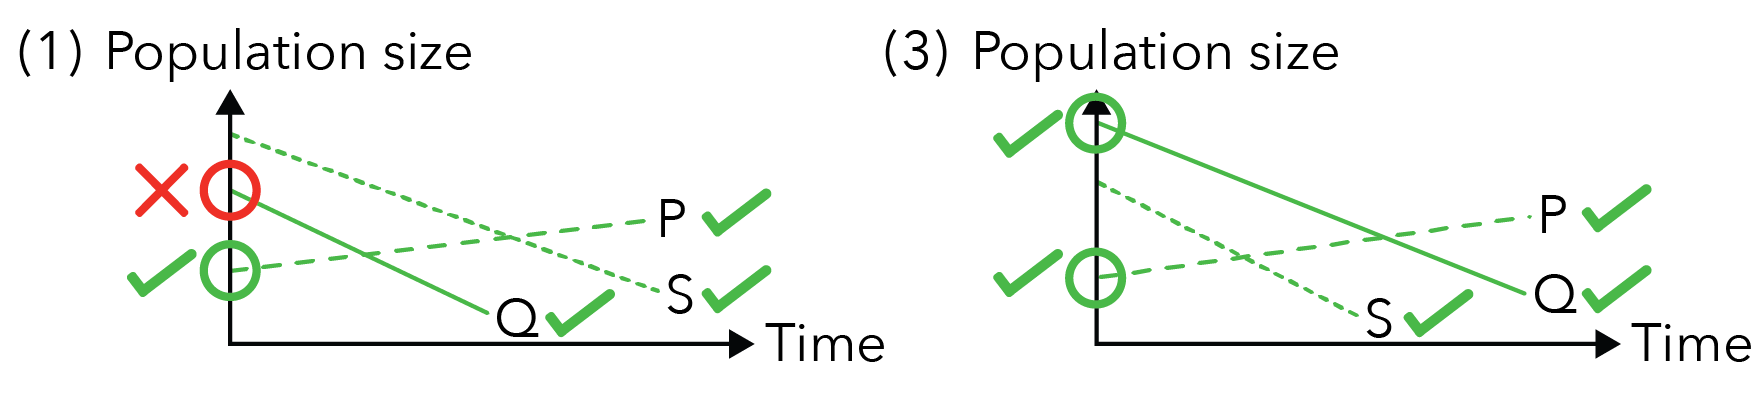
Since organism Q did not have the largest initial population size for option (1), we can now conclude that option (1) is also wrong.
Suggested Answer
Since Q has the largest initial population size while P has the smallest initial population size in option (3), we can conclude that the correct answer will then be option (3).
Moving Forward
I hope this article has helped you gain a better understanding of how to approach Web of Life questions.
In summary, to determine which graph shows the correct change in the population size of different organisms, students must always remember to check for the following:
- The slope of the line representing each organism.
- The initial population size of each organism.
Continue to keep a lookout for our new articles! 🙂

If you like our methodology, we've some upcoming workshops:


