Welcome back to our Examination Paper Analysis series!
In this article, we will be reviewing the 2018 P5 Singapore Chinese Girls’ School SA2 Science examination paper. As usual, we will be starting off with a summary of the topics tested.
What Topics Are Covered In This Paper?
The topics that were tested in Booklets A and B are listed below:
- Animal Classifications (P3)
- Properties of Materials (P3)
- Matter (P4)
- Heat Energy (P4)
- Magnets (P4)
- Plant and Animal Life Cycles (P4)
- Light (P4)
- Cells (P5)
- Body Systems (P5)
- Transport in Plants (P5)
- Plant Cycle (P5)
- Electricity (P5)
- Water Cycle (P5)
- Reproduction in Plants and Humans (P5)
The topics tested have a relatively equal spread over both Primary 4 & 5 topics. This is the allocation of questions from different levels:
- P3 – 3 questions (2 MCQ and 1 OEQ)
- P4 – 15 questions (11 MCQ and 4 OEQ)
- P5 – 22 questions (15 MCQ and 7 OEQ)
I am sure that many of you have realised that questions have evolved from simply “testing students on their knowledge of the concepts” to “testing the students’ ability to apply the concepts that they have learnt to the different scenarios” in recent years.
In this SCGS paper, I have identified 2 interesting questions that require students to think one step further and apply the concepts that they have learnt to their answers.
The questions that I will be discussing are:
- Question 21 (Plant Cycle)
- Question 36 (Heat Energy)
Read Also:
Let Us Take A Look At Q21
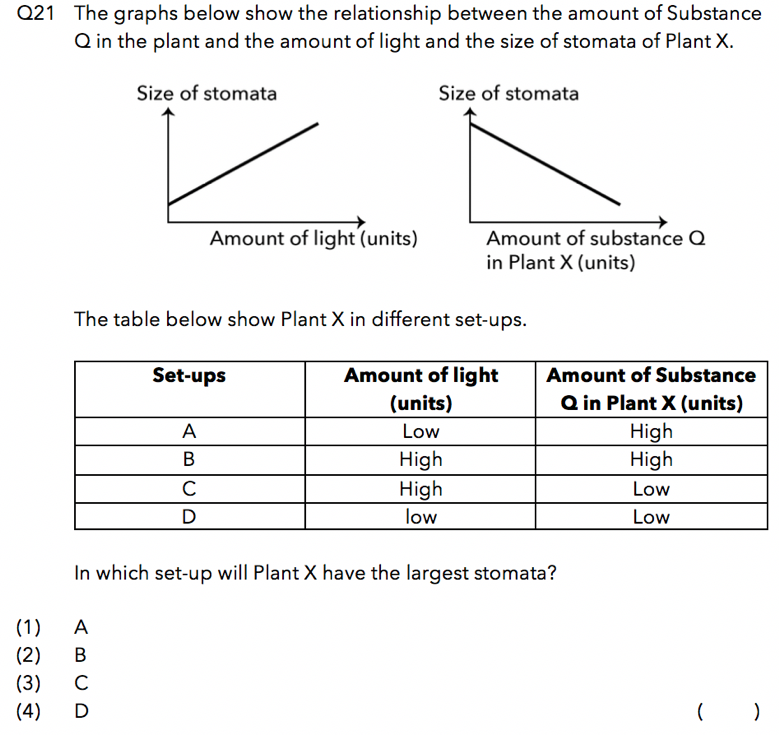
Source: Singapore Chinese Girls’ School – 2018 P5 SA2 Examination Paper [Q21]
Question Analysis
This is a relationship type question where students are required to establish the relationship between the variables. In a typical relationship type question, there are only 2 variables. However, in this question, there are a total of 3 variables.
Variable 1: The amount of light received by Plant X
Variable 2: The amount of substance Q in Plant X
Variable 3: The size of the stomata
In order to solve this question, students need to know how to determine the relationship between the 3 variables.
How To Read Graphs
Before we go further, let me first guide you on how to read graphs. There are four main points to take note of:
1) The bottom axis usually represents the “Changed Variable” and the top axis usually represents the “Measured Variable”.
2) The direction that the red and blue arrows are pointing in indicates an increase of the variable represented by the respective axis. (as shown in the graphs below).
3) If the line given in the graph is in the SAME direction as the blue arrow, this shows that the measured variable is INCREASING.
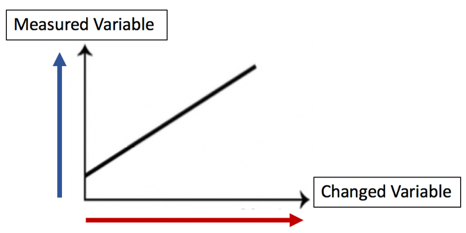
4) If the line given in the graph is in the OPPOSITE direction as the blue arrow, this shows that the measured variable is DECREASING.
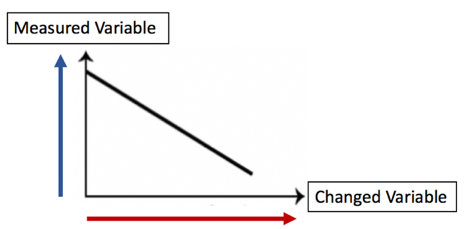
5) In both points 3 and 4, the changed variable increases. You should take note that since we read the changed variable from the left to the right, the changed variable in a graph ALWAYS increases.
Now that we’ve learnt how to read graphs, let’s analyse the graphs given in the question together.
How To Establish The Relationship Between The 3 Variables
To establish the relationship between the 3 variables, we must first identify the relationship between the 2 variables in each individual graph.
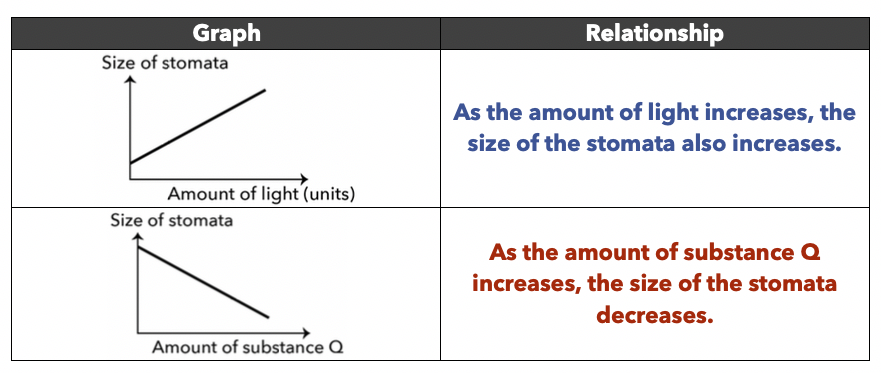
By integrating the 2 relationships that we’ve interpreted from the graphs, we are now able to establish the relationship between the 3 variables.
“As the amount of light increases and the amount of substance Q decreases, the size of the stomata increases.”
Based on the above relationships, we can identify 2 reasons for the increase in the size of the stomata.
- The amount of light increased
- The amount of substance Q decreased
Under What Conditions Will We Get The Largest Stomata?
Based on the relationship established earlier, the greatest amount of light and the smallest amount of substance Q would allow us to obtain the largest stomata.
Finding the correct answer
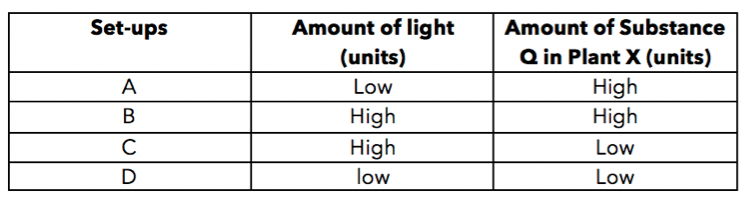
Looking at the 4 set-ups given in the question, the set-up that satisfies the two conditions mentioned above is Set-up C.
Thus, the answer to this question is Option 3.
Now, Let’s Take A Look At Q36a
Source: Singapore Chinese Girls’ School – 2018 P5 SA2 Examination Paper [Q36a]
Question Analysis
This is another relationship type question where the question tests students about the relationship between two variables.
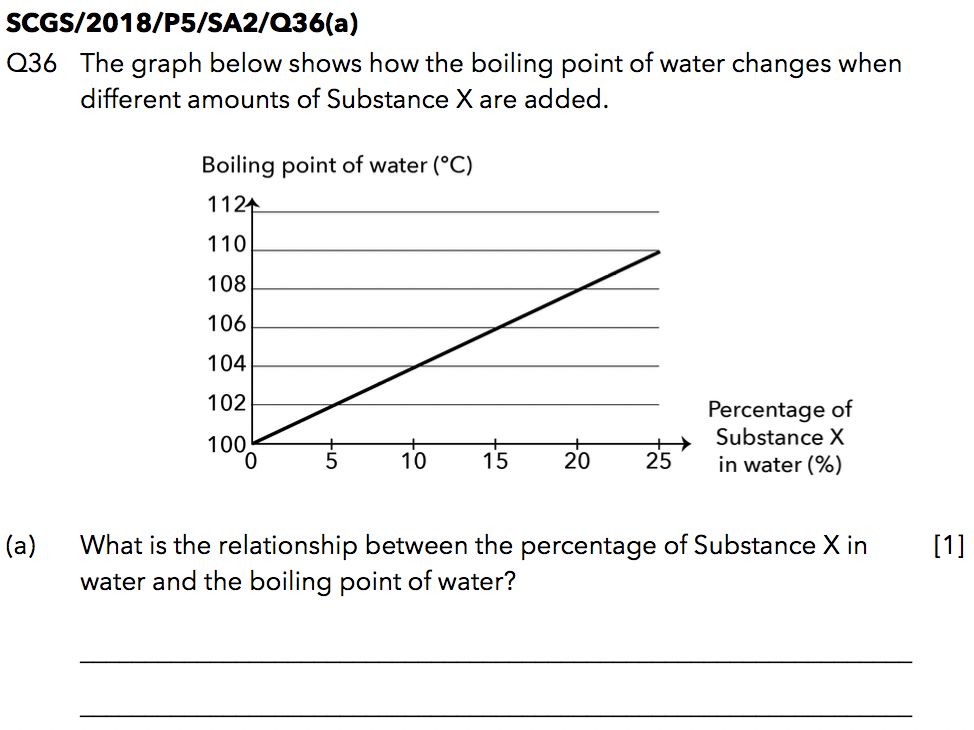
When we come across relationship type questions, we have to first identify what the changed variable and measured variable are:
Changed Variable: Percentage of Substance X in Water
Measured Variable: Boiling Point of Water
As students usually do not face as much of a challenge answering relationship type questions with 2 variables, I will go straight to the answer to this question.
Here’s The Answer to Q36a
As the percentage of Substance X in the water increases, the boiling point of the water increases.
Now, Let’s Take A Look At Q36biii
Source: Singapore Chinese Girls’ School – 2018 P5 SA2 Examination Paper [Q36biii]
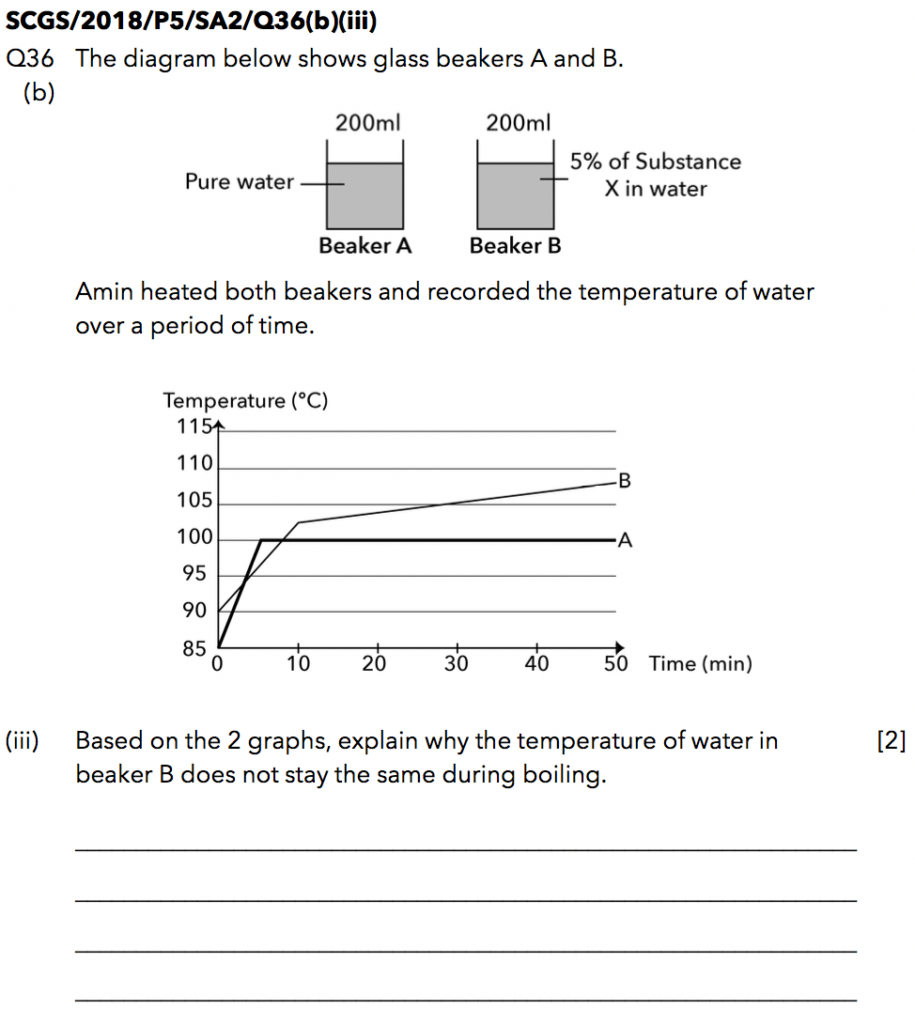
In a typical heat graph for pure water, the temperature of water DOES NOT change when the water is boiling (Line Graph A). However, in this question, the temperature of the water is changing when the water is boiling (Line Graph B).
Now, you must be thinking that this question is not set fairly because students are not expected to know that impurities cause the boiling point to change! In light of this, I’d like to assure you that this question is definitely set and tested within the confines of the PSLE Science syllabus and I’ll explain why in the next section of my question analysis.
Question Analysis
When water boils, water changes from liquid to gaseous state. This would cause a decrease in the volume of water in Beaker B over time.
Below is an illustration to help you visualise this scenario better.
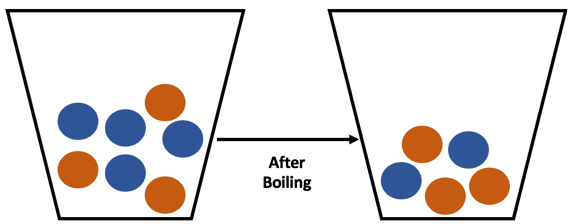
The blue balls represent water and the orange balls represent Substance X.
The beaker started off with 4 blue balls and 3 orange balls.
When boiling occurs, water gains heat from the heat source and turns into steam. Thus, the number of blue balls decreases while the number of orange balls remains the same (as Substance X does not boil or evaporate).
With less water but the same amount of Substance X in the beaker, this results in an increase in the percentage of Substance X in the water.
To answer Q36ciii accurately, we will need to draw the link between Q36ciii and Q36a.
Recall the answer from part (a) earlier:
“As the percentage of Substance X in water increases, the boiling point of water increases.”
Here’s The Suggested Answer to Q36biii
“As the water in Beaker B boils to form steam, the volume of water left in Beaker B decreases, causing the percentage of Substance X in the water to increase. The increase in the percentage of Substance X causes the boiling point of water to increase. This results in the temperature of water in Beaker B to increase during boiling.”
Moving Forward
I’d like to end this article with a piece of advice that I often share with my students.
“Whenever your mind goes blank and you have no idea how to tackle the question, go back to the earlier sections of the question to find clues. In many questions, understanding part (a) of a question is integral to answering part (b) of the question accurately”
I hope you enjoyed the analysis of this SCGS paper! Stay tuned for our next article! 🙂

If you like our methodology, we've some upcoming workshops:

