
Introduction
Welcome to another blog post on the topic of Solutions & Suspensions!
Do you find graphs confusing so you often get stuck when you see them in your examination paper?
Keep on reading because, in this blog post, I will be teaching you how to analyse solubility and temperature graphs so you can arrive at the correct conclusion.
Alternatively, you can watch our explainer video by clicking this link.

Read Also:
Let’s Take A Look At This Solutions & Suspensions Question
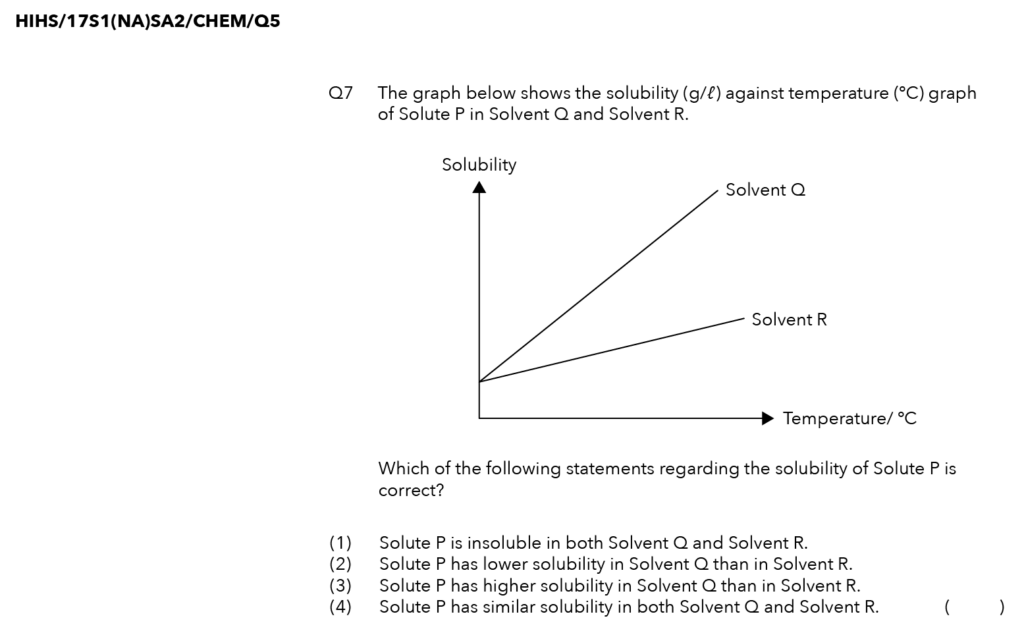
Source: Holy Innocents’ High School – S1(NA) SA2 Examination Paper [Q5]
Thought Process
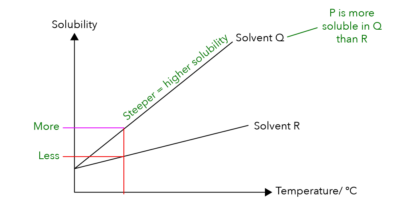
💧 What Is Solubility? 💧
Solubility is the maximum amount of solute that can dissolve in a given amount of solvent.
In the case of our experiment, we have 1 litre of the solvent at a fixed temperature.
Let us draw a straight line from the x-axis, growing upwards to touch graph R. The red line in the graph below represents the maximum amount of Solute P that can dissolve in Solvent R at that temperature.
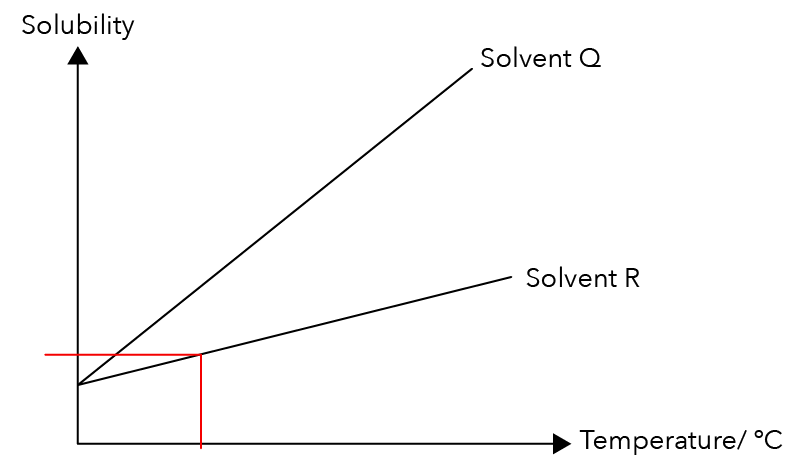
Source: Holy Innocents’ High School – S1(NA) SA2 Examination Paper [Q5]
Let us continue the straight line from the fixed temperature and touch graph Q. The purple line in the graph below represents the maximum amount of Solute P that can dissolve in Solvent Q.
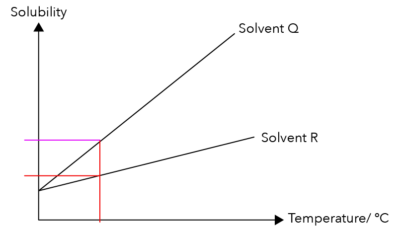
Let us compare the positions of the purple and red lines. Which is higher? The purple line is higher than the red line.
What does this mean?
This means that more Solute P can dissolve in Solvent Q compared to Solvent R at the same fixed temperature.
Considering this information, does Solute P dissolve more easily in Solvent Q or Solvent R?
Solute P dissolves more easily in Solvent Q!
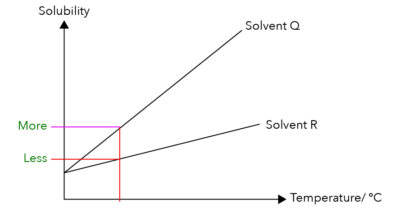
A trick that we can use for this question is to look at the gradients for graph Q and graph R.
Which graph is steeper?
The graph of Solvent Q is steeper! Since it is steeper, it means that Solute P would have a higher solubility in Solvent Q.
Now that we know these information, let us begin analysing the different options.
Let’s Analyse Option (1)

Source: Holy Innocents’ High School – S1(NA) SA2 Examination Paper [Q5]
Is Solute P insoluble in both solvents Q and R?
We know that this is not true since P can dissolve in both solvents!
Therefore, this option is wrong.
Let’s Analyse Option (2)
![]()
Source: Holy Innocents’ High School – S1(NA) SA2 Examination Paper [Q5]
Next, does Solute P have a lower solubility in Solvent Q than in Solvent R?
In fact, the opposite is true! Solute P has a higher solubility in Solvent Q than in Solvent R.
So, this option is wrong too.
Let’s Analyse Option (3)
![]()
Source: Holy Innocents’ High School – S1(NA) SA2 Examination Paper [Q5]
Does Solute P have a higher solubility in Solvent Q than in Solvent R?
Refer back to the graph. You can confirm that Solute P indeed has a higher solubility in Solvent Q than in Solvent R.
So this option is correct.
But before concluding that this is the correct answer, let us first take a look at option (4).
Let’s Analyse Option (4)
![]()
Source: Holy Innocents’ High School – S1(NA) SA2 Examination Paper [Q5]
Does Solute P have a similar solubility in both Solvents Q and R?
It does not have similar solubilities in both solvents.
Therefore, this option is wrong as well.
Suggested Answer
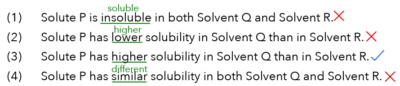
Therefore, we can conclude that the correct answer is (3).
Conclusion
I hope that after reading this blog post, you’ve learned how to read a solubility-temperature graph accurately!
Because the line for Solvent Q is steeper than Solvent R, it means that Solute P has a higher solubility in Q than in R.
Make notes on the graph as we did above so that you can:
- Start solving the question correctly
- Save time when checking your answer
Keep a lookout for more Solutions & Suspensions blog posts!

If you like our methodology, we’ve some upcoming workshops:


